Copyright 2000, P. Cinzano, Thiene, Italy
All rights reserved
Maps of night sky brightness in Italy
Artificial Night Sky Brightness (polluted areas)
Total night sky brightness (night sky luminosity)
Naked eye stellar visibility (stellar visibility)
Loss of naked eye limiting magnitude (polluted areas)
For the maps of other world countries see The Night Sky in the World o The First World Atlas of Artificial Night Sky Brightness.
The meanings of the maps is summarized in the following table:
| Quantity |
Meanings |
Artificial Night Sky Brightness |
Light pollution in atmosphere, more polluted or polluting areas |
Total night sky brightness |
night sky luminosity |
Naked eye stellar visibility |
stellar visibility |
Loss of naked eye limiting magnitude |
Impairment of stellar visibility |
The maps have been computed for standard clean atmosphere with aerosol clarity K=1(Garstang 1986, 1989), corresponding to a vertical extinction in photometrical V band of 0.33 mag at sea level (0.21 mag at 1000m o.s.l., 0.15 mag at 2000m o.s.l., horizontal visibility at sea level 26 km.). The map was obtained from data taken in 1996-1997 rescaled to 1998-1999 based on the fitting to observations of night sky brightness taken from the Earth surface. Each pixel is 30''x30'' in size in longitude/latitude projection, corresponding approximately to 0.9x0.6 km at a latitude of 45°N. Country boundaries are approximate. Mountain screening was neglected.
Artificial Night Sky Brightness
The maps of the artificial night sky brightness at zenith at sea level allow to compare levels of light pollution in the atmosphere, to recognize more and less polluted areas and to identify the more polluting districts and the bigger sources.
These maps are intended to show the levels of pollution in the atmosphere rather than the stellar visibility which is the aim of the other maps described afterwards. The assumption of sea level and standard clear atmospherical conditions allows to compare pollution of different areas, to recognize more polluting sources or darker areas (areas with less light in the atmosphere and not areas where you see better the stars) without be confused by the altitude effects.
However you do not see a big difference accounting for altitude (e.g. in correspondence of Mount Ekar, at the borders of the padana plane, rising from sea level to 1350 m of elevation the artificial sky brightness diminishes less than about 20% whereas color levels in our maps shows each one three times larger brightness than the previous one.)
These maps do not give information on the star visibility, however mainly polluted areas usually are at sea level, so very approximately we can say that the orange level in our standard scale indicates areas where the milky way is invisible or quite difficult to see by an average observer in normal clear nights. The red areas indicates zones where very approximately one hundredth of stars, or few more, is visible over 30 degrees of elevation. Blue border indicates artificial sky brightness over 10% than the natural brightness which is the definition of "light polluted sky". Yellow indicates an artificial sky brightness equal to the natural so that the total sky brightness is doubled.
Maps show the artificial sky brightness at the zenith in clean nights in V band, obtained by integration of the contributions produced by every surface area in the surroundings of the site. Each contribution is computed taking into account based on Garstang models the propagation in the atmosphere of the upward light flux emitted by the area and measured by the Operational Linescan System of US Air Force DMSP satellites. We account for extinction along light paths, double scattering of light from atmospheric molecules and aerosols, Earth curvature and aerosol content of the atmosphere.
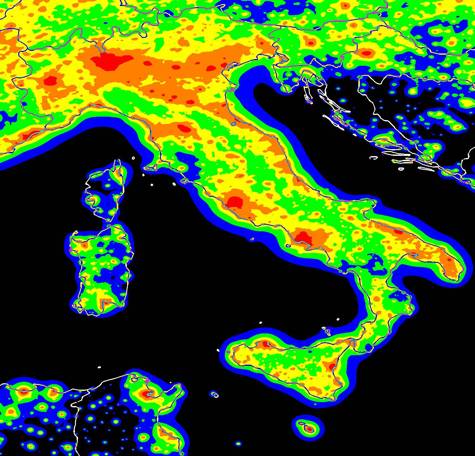
Artificial Night Sky Brightness at sea level in Italy.
from The artificial night sky brightness mapped from DMSP Operational Linescan System measurements P. Cinzano (Dipartimento di Astronomia, Università di Padova), F. Falchi (Dipartimento di Astronomia, Università di Padova), C.D. Elvidge (NOAA National Geophysical Data Center, Boulder), Baugh K. (NOAA National Geophysical Data Center, Boulder), Monthly Notices of the Royal Astronomical Society, 318, 641-657 (2000)
Colours correspond to ratios between the artificial sky brightness and the natural sky brightness (8.61 107 ph cm-2 s-1 sr-1 oppure 252 μcd/m2).
| <11% |
black |
11-33% |
blue |
33-100% |
green |
1-3 |
yellow |
3-9 |
orange |
>9 |
red |
Total night sky brightness
The maps of the the total night sky brightness show the quality of the night sky in the territory. They usually are computed at zenith, accounting for the elevation and the natural sky brightness. In smaller-size maps we also account for screening by mountain and terrain elevation.
The elevation has effect on the natural sky brightness, on the artificial sky brightness and on the stellar extinction and is obtained from a digital elevation map (DEM). The natural sky brightness depends on the chosen direction of view and on the altitude and it is obtained with Garstang (1989) models which account for the light coming from the entire sky and scattered along the line of sight of the observer and for the given atmospherical conditions. The mountain screening is obtained evaluating the elevation of each pixel along the line which connect each site with each source and then computing the maximum screening angle from which we determine the fraction of the line of sight shielded.
Darker areas (white color) looks slightly larger in these maps than in maps of artificial night sky brightness. This is an apparent effect due to the large interval of our colour levels (0.5 mag/arcsec^2) which do not show where the artificial sky brightness is a fraction of the natural one.
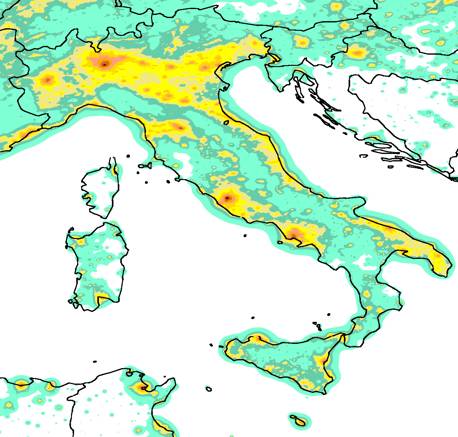
Total night sky brightness in Italy.
from Naked eye star visibility and limiting magnitude mapped from DMSP-OLS satellite data, P. Cinzano ( Dipartimento di Astronomia, Università di Padova), F. Falchi (Dipartimento di Astronomia, Università di Padova), C.D. Elvidge (NOAA National Geophysical Data Center, Boulder), Monthly Notices of the Royal Astronomical Society, 323, 34-46 (2001)
Levels correspond to total sky brightness of V mag/arcsec2:
| >21.5 |
white |
21-21.5 |
green |
20.5-21 |
dark green |
20-20.5 |
kaki |
19.5-20 |
yellow |
19-19.5 |
dark yellow |
18.5-19 |
pink |
18-18.5 |
orange |
17.5-18 |
maroon |
<17.5 |
dark red |
The table below relates the zenith night sky brightness in magnitudes per square arcsecond to a qualitative judgement on its luminosity. Even if it has no pretension of accuracy, it can be useful to understand the meanings of the brightness values in the caption. It should be taken into account that any judgement is always subjective. E.g. a brightness of 21 mag/arcsec2 could be considered extremely high for a site which was very dark in the past.
| <19.5 mag/arcsec2 |
strongly luminous sky |
20 mag/arcsec2 |
very luminous sky |
20.5 mag/arcsec2 |
luminous sky |
21 mag/arcsec2 |
slightly luminous sky |
21.5 mag/arcsec2 |
averagely dark sky |
>21.5 mag/arcsec2 |
extremely dark sky |
Naked eye stellar visibility
The maps of the stellar visibility (naked eye limiting magnitude) show the capability of the population to see the stars. They usually are computed at zenith, accounting for the extinction of the star light in the atmosphere from the top of the atmosphere to the observer and the eye capability to detect point sources over a light background.
They are unsuitable to evaluate the light pollution of the atmosphere (artificial radiation density) because the elevation and extinction of the light confuse the behaviour. As an example, the mountains near the top of the image below could appear unpolluted because they show the same limiting magnitude than unpolluted zones of the sea at lover left corner. However the stellar extinction from an elevated site is less than from sea level and the number of particles and molecules which can scatter the artificial light is less too, so limiting magnitude and stellar visibility increase with elevation. In conclusion the similar limiting magnitude in the mountains and in the unpolluted areas of the sea means that the mountains are polluted SO MUCH that the stellar visibility there is comparable with the visibility from sea level.
As Blackwell (1946) and many other authors showed, the relation between limiting magnitude and sky brightness is not linear and, moreover, it is a statistical concept. A number of random factors affect eye measurements (Garstang 2000; Schaefer 1991) like the individual eye capability, the individual pupil size, the experience that makes the observer confident of a detection at a probability level different from another, the duration of the observation and so on. So we can predict only the star visibility by an average observer even if we account for many details (e.g. observer pupil diameter depending on the age; Stiles-Crawford effect (a decrease of the efficiency in detecting photons with the distance from the centre of the pupil); colour differences between the laboratory sources and the observed star; colour differences between the laboratory sources and the night sky; differences between the night vision curve and the V band in computing the stellar extinction.
The figure shows the centre of the statistical distribution of the naked eye limiting magnitude in Europe at the zenith for observers of average experience and capability, aged 40 years, with the eyes adapted to the dark, observing with both eyes the fainter star surely seen. As discussed from Schaefer (1991) expert amateur astronomers could be able to detect stars even one magnitude fainter if the sky luminosity allow a sufficient adaptment to dark.
. 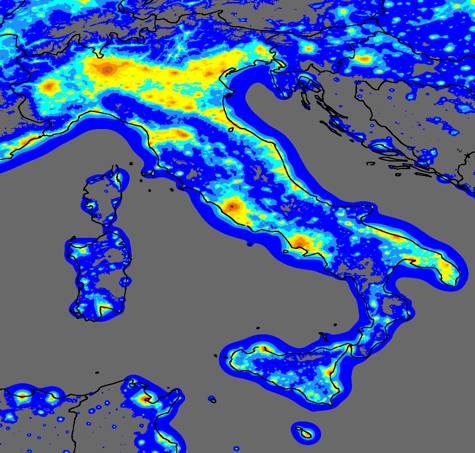
Naked eye stellar visibility in Italy.
from Naked eye star visibility and limiting magnitude mapped from DMSP-OLS satellite data, P. Cinzano (Dipartimento di Astronomia, Università di Padova), F. Falchi (Dipartimento di Astronomia, Università di Padova), C.D. Elvidge (NOAA National Geophysical Data Center, Boulder), Monthly Notices of the Royal Astronomical Society, 323, 34-46 (2001)
Levels correspond to V magnitudes:
| >6.0 |
black |
5.75-6.0 |
grey |
5.5-5.75 |
blue |
5.25-5.5 |
light blue |
5.0-5.25 |
azure |
4.75-5.0 |
yellow |
4.5-4.75 |
golden yellow |
4.25-4.5 |
orange |
4.0-4.25 |
dark orange |
3.75-4.0 |
red |
<3.75 |
violet |
Un cielo ben fruibile e che non penalizzi troppo l'osservazione astronomica è quello con magnitudine limite superiore a 5.5 mag, indicato nella mappa in blu, grigio e nero. Come si vede non esistono zone sul territorio italiano rappresentate in nero, esse si trovano su montagne poste in zone incontaminate. Anche le zone indicate in grigio e blu, con gli attuali tassi di crescita della brillanza artificiale, sono destinate a restringersi fino a sparire, a meno di sostanziali interventi legislativi correttivi.
The table below relates the limiting magnitude in V band to a qualitative judgement on the quality of the visible sky. It has no pretension of accuracy and it constitutes a risky judgement, but it could be useful to understand the meanings of the values in the caption above. It should be taken into account that any judgement is always subjective and that differences between an average observer and an expert one hold even here.
| mag 4 |
hardly starred sky |
mag 4.5 |
slightly starred sky |
mag 5 |
averagely starred sky |
mag 5.5 |
very starred sky |
mag 6 |
widely starred sky |
mag 6.5 |
exceptionally starred sky |
Loss of naked eye limiting magnitude
The maps of the loss of naked eye limiting magnitude show the loss of the capability of the population to see the stars. They are obtained simply by the difference between the map of the star visibility and a map of the same quantity evaluated assuming no light pollution in the area. The difference with the previous map is that in this case the effects of the light pollution are clearly visible but these maps are less useful to find the best observative sites.
Asbefore, the loss of lnaked eye limiting magnitudes are computed for observers of average experience and capability, aged 40 years, with the eyes adapted to the dark, observing with both eyes toward the zenith.
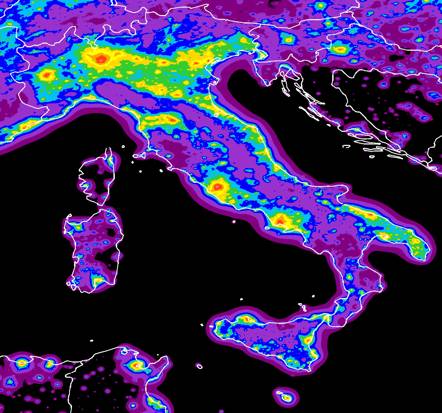
Figura 5. loss of naked eye limiting magnitude in Italy .
This map is copyright but may be reproduced by the press in articles citing the related research with the following credit/copyright statement: P. Cinzano (University of Padova), F. Falchi (University of Padova), C. D. Elvidge (NOAA National Geophysical Data Center, Boulder). Copyright 2001 ISTIL, Thiene. Reproduced from www.lightpollution.it.
Levels correspond to magnitude loss (in V mag.):
| <0.1 | black |
0.1-0.2 |
purple |
0.2-0.4 |
orchid |
0.4-0.6 |
blue |
0.6-0.8 |
light blue |
0.8-1.0 |
green |
1.0-1.2 |
golden yellow |
1.2-1.4 |
yellow |
1.4-1.6 |
orange |
1.6-1.8 |
red |
1.8-2.0 |
hot pink |
>2.0 |
pink |